an ordinary trading page based on technical trading... (since 2008)
1. "MUST" take every signal shown by system
2. "NEVER" invest > 30% out from capital, balance capital for backup
3. "INCREASE" position only after 20-30% increase in capital
*Futures Crude Palm Oil: current position for GT2
Step 1: Holding> February contract LONG 3053 (01.12.11)
Step 3: Entry> No SAR signal yet..
*Futures Kuala Lumpur Index: current position for RJ1
Step 1: Holding> LONG 1436 November (24.11.11)
Step 2: Stop> i dont use STOP!!
Step 3: Entry> No SAR signal yet..
*will be updated after market
*PLEASE SCROLL DOWN DOWN DOWN TO VIEW MY GT2 SYSTEM PERFORMANCE
Wise Words from Ed Seykota
Wednesday, December 1, 2010
Testing New System Update
My Small Account Monthly Update: November 2010
FKLI Update: Rollover
Tuesday, November 30, 2010
Testing New System Update
1-13) Start 29.10.2010, Up +381.. (sorry i'm lazy to post one by one)
14)25.11>LONG 3214-SELL 3377 = +163 (30.11) total> +544
15)30.11>SHOT 3377-BUY ?? =
*15 trades (9win- 5losses), 1 still open Shot
Thursday, November 25, 2010
My new, faster swing system trading (still TESTING mode)
*My backtest started from 29/10/2010 and already up about 380+/- pts (i cannot remember the exact winning points, left the record in my office).. maybe i will post the tested NEW system here by tomorrow..
*Base from the date started this new system beat my current ROJAK BEST OF THE BEST SYSTEM by about 100pts+/- (not so sure, cannot remember) but the downside this new system give signal more often 14 against 3.. hahaha
*I'll test till year end to see how it perform against my proven ROJAK SYSTEM
CPO Update: Turn LONG
*FKLI still same case, still holding November LONG 1505 (roll)..
An Introduction To CANDLESTICKS, PART 4
Buy on Greed, Sell on Fear
There are only two forces behind the supply and demand forces that
drive a stock's price higher or lower.
Those forces are the emotional forces of fear and greed. To illustrate
this point we refer to Figure 11.

Figure 11
Suppose you are a trader observing the bullish rally of Stock XYZ at
the beginning of the 3rd bullish green candlestick, and considering an
entry.
You have witnessed the stock rally huge for two days and know that
each trader who entered on the first two days is now a big winner.
Based on the emotion of greed you decide to enter at that beginning of
the 3 day, and mentally count your profits as the price rallies to a new
high.
After the stock closes, you brag to your friends at the golf course
regarding the great trade that you made that day.
You go home from the golf course and celebrate the victory with your
spouse and maybe even discuss how you will use the extra money that
you have earned through the trade.
Now keep in mind that the profit is only on paper and not one penny
has been earned yet.
The next morning you check the price of your position, with
expectations that your bullish stock will rocket to the moon! Now
imagine the emotion that goes through your mind when your position
not only fails to go higher, but also opens below your entry price.
What is the emotion that flows through your body as you not only see
your profits erode before your eyes, but now rob your account of
precious capital?
The emotion that you will experience is undoubtedly fear and will
prompt you to scramble to liquidate your position as soon as possible
to minimize your losses.
Now consider that there were also 2 or 3 thousand additional traders
who entered the same stock at around the same price with the hopes
of the gaining the same
profit.
All of these traders will be tripping over themselves trying to get out of
the stock.
As was illustrated in the previous section, this increase in fear results
in an increase in supply of the stock relative to the increase in
demand, and triggers the sharp decline in the price.
The deeper the red candlestick cuts into the bullish green candlesticks,
the more traders are thrown into losing positions, and thus the further
the price decline.
Perhaps you are beginning to realize the power of emotions in price
movements of a stock.
The technical analyst through candlestick reading is trained to read
this greed and fear emotions in the market and capitalize on them.
Capitalizing on Fear and Greed
From the previous section, we determined that price movements result
from massive emotions of fear and greed regarding trader's position in
the market with a given stock.
Recognizing the footprints of greed and fear is not difficult.
Recognizing the signs that the rally or decline before it happens is the
difficult part of trading. How many times has this situation happened
to you: You enter a trade based on a bullish reversal signal, but then
exit on a slight pull back only too see the stock rally to a new high
after you exit.
Or how often have you held on to a stock that experiences a bearish
pull back in hopes that it will turn around, only to see the stock
plummet to new lows before you finally concede to defeat and exit.
Unfortunately, there is no system that can predict with 100% accuracy
exactly where a greed rally or fear sell off begins. There are;
however, techniques based on candlestick patterns that help us locate
probable areas for these turning points. The rest of this section will
explore the techniques in identifying those probable areas that
properly managed will result in profits for the trader in
the long run.
Wednesday, November 24, 2010
Monday, November 22, 2010
CPO Commentary
* Market Talk: Market expected that overall November exports would increase 8%-10% from a month earlier and will remain strong into the first half of December.
Cargo surveyor ITS on last Sat pegged Malaysia’s Nov 1-20 days palm oil export at 1,053,520 metric tons, increased 11.5% from the last correspondent period. The figures are close to early expectation of around 1.06 million tons. Cargo surveyors SGS is scheduled to release its exports estimation on today.
Outlook
* Fundamental: CPO prices are likely to be supportive on expectation of higher exports in November and that Indonesia may increase export levy. Watch for export estimation due today.
* Technical: Despite CPO futures settled marginally 8 points higher last Friday, the daily MACD turned bearish mode, coincided with daily Parabolic SAR indicating a sell signal, likely indication a pause on the medium-term uptrend. Also, a daily Doji candle formed after a significant uptrend last Friday, signifying prices are indecision in direction. Note that, a black daily candle to close below 3326, closing of Nov 19, will confirm the evening star reversal chart pattern and accelerate the selling momentum to test 3114, low of Nov 18.
With daily MACD and Parabolic indicating a sell signal, we would advise on selling on strength with a stop loss at daily Parabolic SAR of 3417. Nevertheless, we believe the long-term uptrend and Elliott primary wave count are still intact and the medium-term correction is coincided with the daily primary wave 4 correction. Any breakout above the said resistance will likely to indicate a continuation of daily primary impulse wave 5.
#Courtesy Inter-Pacific Securities Sdn Bhd, for enquiries please contact 03-21427586 or email :- tanks@interpac.com.my (please mention my site http://www.fkli.co.cc/ when enquiring)
Saturday, November 20, 2010
Soybean Oil Daily Chart
* See for yourself, lower high in the making & very bearish candle (what they call it Engulfing Something??) ... But if you ask me whats going to happen to Soybean Oil or Crude Palm Oil, further down or up, seriously i've no idea.
Friday, November 19, 2010
Tun Dr. Mahathir Mohamad Facebook Posting
THE STOCK MARKET
by Dr. Mahathir bin Mohamad on Friday, November 19, 2010 at 9:57am
1. Lately we have been seeing rather rapid increases in the Kuala Lumpur Composite Index. Those who play the stock market must be feeling very happy. Much money must be made by investors from capital gains.
2. Some people believe that the rise of the KLCI is an indicator of the healthy state of the Malaysian economy. This may be true but let me throw some cold water in the belief that the index indicates that the economy is doing very well.
3. It is doing fairly well, no doubt, but that is not enough to push the KLCI to record highs. What is happening is that a lot of foreign money is coming in to buy Malaysian stocks.
4.In itself it is not bad. It is also a kind of foreign direct investment (FDI). But this kind of FDI is not about setting up industries to produce goods for export. The latter will not be easily liquidated to take the invested capital out. The plants which are set up cannot be easily sold. The Investors will have to manage them through good and bad times to get a return on their investments.
5. But FDI in stocks and shares can be sold any time and the proceeds taken out.
6. Just as increases in investments push up share prices and the KLCI, rapid or massive divestments will push down the share prices and index.
7. We read in the papers that the Federal Reserve Bank of the United States is pumping US600 billion Dollars into the US economy. A part of this money will no doubt be used to invest in stock and shares of the developing economies. The result of this FDI-financed purchases will be a rise in the share prices and the KLCI.
8. In 1997-1998 the foreign investors pulled out their investments and the KLCI dropped from 1,300 to 262. Naturally a lot of local investors lost money. They could not meet margin calls nor raise money to augment collaterals for their bank loans.
9. The banks found themselves burdened with large numbers of non-performing loans and had to face the threat of bankruptcy.
10. Should the banks collapse the economy of the country will go into a tailspin. It did in 1997-1998. It will happen again should the foreign investors dump their Malaysian shares to take profits from capital gains.
11. Foreign funds, especially from the US coming in to invest in Malaysia's stock market at this time must be considered as hot money. I would not be suprised when the KLCI peaks the foreign investors will dump their shares and collect capital gains. The share prices will fall rapidly and Malaysians who had chased the shares on their way up will be asked to meet margin calls. If they fail they will lose a lot of money.
12. I hope I am wrong. But sometimes my predictions about money and markets have proven to be right. In any case I only own 200 Malayan Tobacco shares bought before I became Education Minister. I have nothing to gain or to lose, but the country and the stock market investors will lose.
Tuesday, November 16, 2010
The End of my LONG run for CPO..

* After a LONG run for CPO, today my system SCREAMING to SHOT.. this run generate profit about 552+/- points.. Now officially i'm holding SHOT 3288.. how long i'll hold this SHOT? hmmm wait n see, i have no answer..
CPO & FKLI update for Hari Raya Haji holiday
* FKLI- Still the same i'm holding my November month LONG 1505 (roll)..
CPO rollover today
Monday, November 15, 2010
CPO Commentary
* Market Talk: CPO prices will continue their rally up to the middle of 2011 after hitting their highest level in over two year, Lee Yeow Chor, executive director of Malaysia's IOI Corp said.
A local broking house upwardly revised its projection on CPO prices to MYR2.700 per ton for 2010 and 2011 respectively, compared with early projection of MYR2,500 per tons due to weak Malaysian output and strong exports. Its commented that palm oil supply would remain tight in the first half of 2011 and would support the prices. However, CPO prices was expected to be capped to between MYR3,300 and MYR3,500 per ton.
Outlook
* Fundamental: We expect some selling pressure on spillover weakness from crude oil and soyoil losses in last Friday. Watch out the export estimation due today.
* Technical: Reuters Jefferies CRB Index broke down the daily uptrend channel of 307.16 and settled at 303.16 last Friday, signaling further weakness in general commodities in the near term. Also, CPO prices broke down the shortterm hourly uptrend channel with bearish hourly Parabolic SAR, increasing the shortterm selling momentum in the near term.
However, there are no major changes in the bullish daily indicators and hence we believe any correction in the near term is healthy for further price advancement in the long term basis. This is also coincide with the start of daily Elliott primary and minor corrective wave 4 with a rising short-term target of 3216, target of minor corrective wave 4, then 2809, target of primary corrective wave 4. Intraday traders are advised on selling accumulation around 3400 psychology resistant, unless any signs of bottoming and may mean another start of Elliott daily minor or primary impulse wave 5.
#Courtesy Inter-Pacific Securities Sdn Bhd, for enquiries please contact 03-21427586 or email :- tanks@interpac.com.my (please mention my site http://www.fkli.co.cc/ when enquiring)
Friday, November 12, 2010
CPO Commentary
* Market Talk: Market expected CPO prices could remain above MYR3,000 per ton for the rest of 2010 till first quarter of 2011 amid shrinking supply and as demand remains strong from China. Meanwhile, concerns of possible lower palm oil production continues as uncertain weather patterns triggered flood in palm oil growing region in Kedah and Perlis.
Outlook
* Fundamental: At the time this report is written, Palm Olein futures traded in Dalian Commodity Exchange is down by 4.07% and soyoil futures in CBOT down by 2.7%. We expect prices to tightly trace these two bourses ahead of weekend positioning.
* Technical: Overall technical remains friendly, though a note of caution emerged from the candlestick reading, whereby a daily long upper shadow occurred yesterday, typically a bearish signal particularly when it occurs near a high price level at or when the product is overbought, which in our case, the daily RSI is overbought at 84.247.
For trading purposes, we would advice trading on the hourly uptrend channel, which should begin the day with a resistance 3474 and support at 3372. The support line of the above mentioned channel coincides with weekly Fibonacci projection support of 3366. A breach of these support levels could potentially bring prices down to 3265, the observed low at Nov 8, and subsequently 3210, the rising gap.
#Courtesy Inter-Pacific Securities Sdn Bhd, for enquiries please contact 03-21427586 or email :- tanks@interpac.com.my (please mention my site http://www.fkli.co.cc/ when enquiring)
Thursday, November 11, 2010
Are You A Bull Or A Bear?
Casual acquaintances who come to learn know I trade for a living (something I rarely volunteer without being asked) will always ask whether I’m a bullish or bearish on the market or economy. My reply often irritates them when I say “I’m neither one – I’m just an opportunist.”
What I mean by that is that I go out of my way to avoid placing myself into a neat and tidy category that can influence my analysis of the markets and the stocks I trade. Although I’m far from perfect and sometimes let my opinions cloud my judgment (I am human after all), I do really try to do everything I can to look for opportunities on both sides of the market.
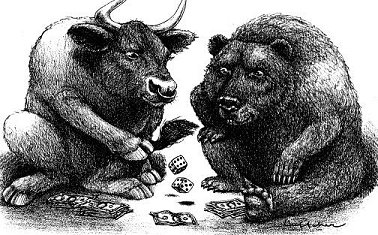
Many investors and also traders try to fit themselves into one neat category based on their opinions or of others who’ve they have come to respect. Even worse, those views are frequently tainted by how their portfolio is currently positioned (people want to be right after all) which can be both dangerous and quite unprofitable.
Believe it or not, some of the most profitable trades I’ve taken have been ones that run contrary to my personal views.
Case in point, I know several traders who are struggling now because they are very bearish about the market. While in principle I agree many of their views, I cannot let those views cloud both my analysis and trading. While I’m fairly certain there will be a time when their views will be proven correct, in this business timing is everything. Opinions after all, don’t pay the bills – only profitable trades do!
As you’ll soon learn if you haven’t already, there is no difference between being “early” and “wrong” in this market. Likewise, it pays to remember there were lots of hedge funds that went broke prior to March of 2000 because they shorted all of the Internet and tech stocks. These guys were proven to be right on the money much later on, but in reality they never were able to take full advantage of it because they lost so much money before the bear returned.
Remember this – in trading it isn’t about who is right or wrong. Instead it is all about who can make money and take advantage of the most opportunities in the present. Opinions are terrific things, but in most cases, you would be wise to set them aside and trade the market you see rather than the market you think you should or want to see.
* This report was originally published by The Kirk Report on April 6, 2004.
My Small Account Statement..

* As requested today i post my statement as per yesterday closing 10 November 2010, after this i'll only post by monthly basis IF only needed yaa..
CPO 2011 (GT2 System Performance)
16)31.03>SHOT 3302-BUY 3343 x 2lots= -82 (31.03)
18)07.04>SHOT 3339-BUY 3342 x 2lots= -6 (07.04)
19)11.04>SHOT 3425-BUY 3344 = +81 (13.04)


