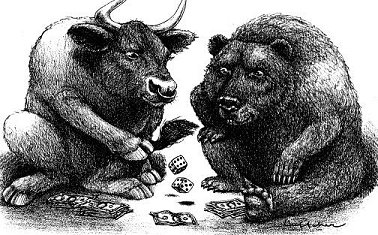
my RULES

1. "MUST" take every signal shown by system
2. "NEVER" invest > 30% out from capital, balance capital for backup
3. "INCREASE" position only after 20-30% increase in capital

*Futures Crude Palm Oil: current position for GT2
Step 1: Holding> February contract LONG 3053 (01.12.11)
Step 2: Stop> i dont use STOP!!
Step 3: Entry> No SAR signal yet..

*Futures Kuala Lumpur Index: current position for RJ1
Step 1: Holding> LONG 1436 November (24.11.11)
Step 2: Stop> i dont use STOP!!
Step 3: Entry> No SAR signal yet..

*will be updated after market

*PLEASE SCROLL DOWN DOWN DOWN TO VIEW MY GT2 SYSTEM PERFORMANCE

Wise Words from Ed Seykota

If I am bullish, I neither buy on a reaction, nor wait for strength; I am already in. I turn bullish at the instant my buy stop is hit, and stay bullish until my sell stop is hit. Being bullish and not being long is illogical. ~ "Market Wizards, Interview with Top Traders - Jack D. Schwager"

Friday, November 19, 2010

Tun Dr. Mahathir Mohamad Facebook Posting

THE STOCK MARKET

by Dr. Mahathir bin Mohamad on Friday, November 19, 2010 at 9:57am

1. Lately we have been seeing rather rapid increases in the Kuala Lumpur Composite Index. Those who play the stock market must be feeling very happy. Much money must be made by investors from capital gains.

2. Some people believe that the rise of the KLCI is an indicator of the healthy state of the Malaysian economy. This may be true but let me throw some cold water in the belief that the index indicates that the economy is doing very well.

3. It is doing fairly well, no doubt, but that is not enough to push the KLCI to record highs. What is happening is that a lot of foreign money is coming in to buy Malaysian stocks.

4.In itself it is not bad. It is also a kind of foreign direct investment (FDI). But this kind of FDI is not about setting up industries to produce goods for export. The latter will not be easily liquidated to take the invested capital out. The plants which are set up cannot be easily sold. The Investors will have to manage them through good and bad times to get a return on their investments.

5. But FDI in stocks and shares can be sold any time and the proceeds taken out.

6. Just as increases in investments push up share prices and the KLCI, rapid or massive divestments will push down the share prices and index.

7. We read in the papers that the Federal Reserve Bank of the United States is pumping US600 billion Dollars into the US economy. A part of this money will no doubt be used to invest in stock and shares of the developing economies. The result of this FDI-financed purchases will be a rise in the share prices and the KLCI.

8. In 1997-1998 the foreign investors pulled out their investments and the KLCI dropped from 1,300 to 262. Naturally a lot of local investors lost money. They could not meet margin calls nor raise money to augment collaterals for their bank loans.

9. The banks found themselves burdened with large numbers of non-performing loans and had to face the threat of bankruptcy.

10. Should the banks collapse the economy of the country will go into a tailspin. It did in 1997-1998. It will happen again should the foreign investors dump their Malaysian shares to take profits from capital gains.

11. Foreign funds, especially from the US coming in to invest in Malaysia's stock market at this time must be considered as hot money. I would not be suprised when the KLCI peaks the foreign investors will dump their shares and collect capital gains. The share prices will fall rapidly and Malaysians who had chased the shares on their way up will be asked to meet margin calls. If they fail they will lose a lot of money.

12. I hope I am wrong. But sometimes my predictions about money and markets have proven to be right. In any case I only own 200 Malayan Tobacco shares bought before I became Education Minister. I have nothing to gain or to lose, but the country and the stock market investors will lose.

Tuesday, November 16, 2010

The End of my LONG run for CPO..


* After a LONG run for CPO, today my system SCREAMING to SHOT.. this run generate profit about 552+/- points.. Now officially i'm holding SHOT 3288.. how long i'll hold this SHOT? hmmm wait n see, i have no answer..

CPO & FKLI update for Hari Raya Haji holiday

* CPO- I just roll my Long position to February contract this morning, my signal triggered and now i holding SHOT 3288 for February contract.

* FKLI- Still the same i'm holding my November month LONG 1505 (roll)..

CPO rollover today

* CPO i roll to February contract LONG 3357..

My CPO & FKLI - Daily chart entry

FKLI


CPO


* Enjoy..

Monday, November 15, 2010

CPO Commentary

News Bites

* Market Talk: CPO prices will continue their rally up to the middle of 2011 after hitting their highest level in over two year, Lee Yeow Chor, executive director of Malaysia's IOI Corp said.

A local broking house upwardly revised its projection on CPO prices to MYR2.700 per ton for 2010 and 2011 respectively, compared with early projection of MYR2,500 per tons due to weak Malaysian output and strong exports. Its commented that palm oil supply would remain tight in the first half of 2011 and would support the prices. However, CPO prices was expected to be capped to between MYR3,300 and MYR3,500 per ton.

Outlook

* Fundamental: We expect some selling pressure on spillover weakness from crude oil and soyoil losses in last Friday. Watch out the export estimation due today.

* Technical: Reuters Jefferies CRB Index broke down the daily uptrend channel of 307.16 and settled at 303.16 last Friday, signaling further weakness in general commodities in the near term. Also, CPO prices broke down the shortterm hourly uptrend channel with bearish hourly Parabolic SAR, increasing the shortterm selling momentum in the near term.

However, there are no major changes in the bullish daily indicators and hence we believe any correction in the near term is healthy for further price advancement in the long term basis. This is also coincide with the start of daily Elliott primary and minor corrective wave 4 with a rising short-term target of 3216, target of minor corrective wave 4, then 2809, target of primary corrective wave 4. Intraday traders are advised on selling accumulation around 3400 psychology resistant, unless any signs of bottoming and may mean another start of Elliott daily minor or primary impulse wave 5.

#Courtesy Inter-Pacific Securities Sdn Bhd, for enquiries please contact 03-21427586 or email :- tanks@interpac.com.my (please mention my site http://www.fkli.co.cc/ when enquiring)

Friday, November 12, 2010

CPO Commentary

News Bites

* Market Talk: Market expected CPO prices could remain above MYR3,000 per ton for the rest of 2010 till first quarter of 2011 amid shrinking supply and as demand remains strong from China. Meanwhile, concerns of possible lower palm oil production continues as uncertain weather patterns triggered flood in palm oil growing region in Kedah and Perlis.

Outlook

* Fundamental: At the time this report is written, Palm Olein futures traded in Dalian Commodity Exchange is down by 4.07% and soyoil futures in CBOT down by 2.7%. We expect prices to tightly trace these two bourses ahead of weekend positioning.

* Technical: Overall technical remains friendly, though a note of caution emerged from the candlestick reading, whereby a daily long upper shadow occurred yesterday, typically a bearish signal particularly when it occurs near a high price level at or when the product is overbought, which in our case, the daily RSI is overbought at 84.247.

For trading purposes, we would advice trading on the hourly uptrend channel, which should begin the day with a resistance 3474 and support at 3372. The support line of the above mentioned channel coincides with weekly Fibonacci projection support of 3366. A breach of these support levels could potentially bring prices down to 3265, the observed low at Nov 8, and subsequently 3210, the rising gap.

#Courtesy Inter-Pacific Securities Sdn Bhd, for enquiries please contact 03-21427586 or email :- tanks@interpac.com.my (please mention my site http://www.fkli.co.cc/ when enquiring)

Thursday, November 11, 2010

Are You A Bull Or A Bear?

Casual acquaintances who come to learn know I trade for a living (something I rarely volunteer without being asked) will always ask whether I’m a bullish or bearish on the market or economy. My reply often irritates them when I say “I’m neither one – I’m just an opportunist.”

What I mean by that is that I go out of my way to avoid placing myself into a neat and tidy category that can influence my analysis of the markets and the stocks I trade. Although I’m far from perfect and sometimes let my opinions cloud my judgment (I am human after all), I do really try to do everything I can to look for opportunities on both sides of the market.

Opportunity

Many investors and also traders try to fit themselves into one neat category based on their opinions or of others who’ve they have come to respect. Even worse, those views are frequently tainted by how their portfolio is currently positioned (people want to be right after all) which can be both dangerous and quite unprofitable.

Believe it or not, some of the most profitable trades I’ve taken have been ones that run contrary to my personal views.

Case in point, I know several traders who are struggling now because they are very bearish about the market. While in principle I agree many of their views, I cannot let those views cloud both my analysis and trading. While I’m fairly certain there will be a time when their views will be proven correct, in this business timing is everything. Opinions after all, don’t pay the bills – only profitable trades do!

As you’ll soon learn if you haven’t already, there is no difference between being “early” and “wrong” in this market. Likewise, it pays to remember there were lots of hedge funds that went broke prior to March of 2000 because they shorted all of the Internet and tech stocks. These guys were proven to be right on the money much later on, but in reality they never were able to take full advantage of it because they lost so much money before the bear returned.

Remember this – in trading it isn’t about who is right or wrong. Instead it is all about who can make money and take advantage of the most opportunities in the present. Opinions are terrific things, but in most cases, you would be wise to set them aside and trade the market you see rather than the market you think you should or want to see.

* This report was originally published by The Kirk Report on April 6, 2004.

My Small Account Statement..


* As requested today i post my statement as per yesterday closing 10 November 2010, after this i'll only post by monthly basis IF only needed yaa..

The Number One Rule of Trading

By Craig Turner

If there is one thing I've learned in all my years in the financial markets, it is never add to a losing position. That means never "average down" a losing long position or "average up" a losing short position. This is even more important when using leverage. There is a very well-know saying, "your first loss is your best loss". What this means is you are best served taking a small loss before it becomes a larger loss, or even worse, a loss that eats up a majority of your trading capital. In order to avoid this major trading mistake, we must first understand why traders add to losers, why traders should not do this, and what they can do to stop it from happening.

Why Traders Add To Losing Positions

Traders stay in losing positions for only two reasons. Either they don't want to be wrong about the market or they don't want to lose money on the trade. Sometimes it is a combination of both. Regardless of which one it is, it causes traders to stay in positions that are going against them.

As traders are losing money, they figure that if they add to the losing position, they can bring the average cost of the position down. For example, let's say a trader wants to be short Crude Oil and he sells 1 contact of Crude Oil at $75.00. Crude is now trading at $80, and the trader is down $5 in crude ($5000). The trader then decides to sell short an additional 2nd crude oil contact at $80. The average short position is $77.50 (the average of $80 and $75).

The trader now only needs Crude Oil to go $2.50 in his favor to get to breakeven at $77.50, instead of $75.00. However, every tick Crude Oil goes against the trader past $80.00 a barrel is going to count twice a much, eating up available capital a double the rate. To make matters worse, markets that are trending in one direction, tend to continue to trend in that direction.

Why Traders Should Not Add To a Losing Position

When a trader is in a losing position, the market is telling him he is wrong. The market is the total sum of psychological, technical and fundamental knowledge. The market is the total sum of all investor knowledge and market opinions. It includes institutional money, sovereign wealth funds, hedge fund managers, trend following funds, commercial hedging interest, and every other participant, large and small.

If a trader continues to hold onto a losing position after the market says he is wrong, the trader is basically saying he is right, and the collective sum or the rest of the market is wrong. In other words, the global consensus is telling the trader the world is round while the trader insists the world is flat. This will almost always lead to larger losses. Bullish markets tend to trade higher, and bearish markets tend to trade lower. It takes something significantly fundamental or technical to occur in that market to change the trend.

Not only is the trader wrong shorting Crude at $75, he is twice as wrong shorting the market again at $80. The losses are now piling up exponentially if he continues to add on to a losing position. Plus, he has now doubled his leverage on a bad trade. Meanwhile, if the trader had just had a $1 or $2 stop on the crude oil position, he would have taken his loss and been done with the trade. He would have been able to admit he was wrong and move onto the next opportunity, instead of creating larger losses and letting other opportunities go by while he was in a losing trade.

Wait Just A Second, I Have "Averaged Down" and Made Money!

If you have averaged down losing positions before, chances are it may have worked in your favor. The problem is, the one time it does not work in your favor you will blow out your account. Every time you "average down" and succeed you are cheating trading death. It is almost like a game of Russian roulette. It only ends once, and when it does, it's over.

"Markets Can Remain Irrational Longer Than You Can Remain Solvent" - John Maynard Keynes

When it comes to leveraged trading, there have never been truer words said. Traders who want to hold onto losing positions "until they come back" to the price they entered may never see it happen. A trader who has a $10K acct short 1 crude at $75.00, only has $10 of room before the account is drawn down to zero. Most people think they will never let a position go against them that far, but it does happen, and there is no assurance that the market will come back to $75 before it gets to $85, causing the trader to liquidate the position for a very large loss.

THE SOLUTION

The simple solution is to never add to a losing position. However, as an experienced broker, analyst, trading newsletter publisher and individual trader, I know that is easier said then done. Here are a few rules to live by in order to help you stop adding to losing positions.

Place Stops Just Outside Normal Trading Ranges

When entering a position, traders need to give their positions enough room to work in their favor, but they also must have stops if the market moves decidedly against them. For a swing or position trader, this means having stops just outside the most recent trading ranges. It could be the previous day's low/high, the past week, or right outside the natural support and resistance lines for the markets. Traders need to define this risk parameter BEFORE they enter the trade. Traders need to know what the risk is and make sure they are comfortable with the risk if they are wrong about the direction of the market.

Mental Clarity Can Only Be Achieved After the Losing Position Is Exited

When a trader is in a losing position and the market keeps on going against them, it is very difficult to approach the situation with a level head and clear mind. The fear of losing money can be the greatest factor in the psychology of trading. It causes traders to see things irrationally, as they do everything possible not to take a loss. This leads to poor decision-making and bad judgment. This is why it is so important to define the stop loss parameters before you enter the market and stick with it.

Unfortunately, sometimes traders get into a trade without a stop or let the position run too far against them. If possible, try to imagine you are flat instead of in the position. Then ask yourself, if you were flat, would you get back into the position? If not, you need to get out, and get out fast. If the trader can't honestly say what he would do, or can't detach from the situation, the best thing to do is exit. Getting out of a loser relieves stress and allows the trader to approach things with a level head. Once the trader is out of the position, he can always get back in if he feels it is the right move. Some traders don't like this method because they don't want to spend the extra commission for getting out and getting back in. However, the clarity that is gained from exiting a losing position is invaluable compared to the extra transaction costs. Don't worry about a few dollars when thousands are at stake.

You Must Be Able to Admit When You Are Wrong and Take a Loss

Being able to admit you are wrong and take a loss is the first step in the journey of successful trading. No one is perfect in trading. Taking a small loss is a minor victory in trading. Being able to let winning trades run and exiting losers for a small loss is what it is all about. However, you can't get to the winners if you take large losses.

It is OK to be wrong. Actually, it is great to be wrong. Why? Because if you can't be wrong, you'll never be right about the markets. Trading is about taking risk and managing risk. The trader who can exit a position going against him early is giving himself the change to win big on the next opportunity.

The Best Traders Add to Winning Positions & Use Stops to Protect Profits

The most successful traders I've seen not only cut their losers quickly, but they let their winners run and add on as they go in their favor. They never average down losers, but they will certainly average up on winners. While some might not want to trade multiple lots, I think the concept is very important. When you have a winning position, the market is telling you that you are correct. The collective sum of all knowledge in the market place is in total agreement with you. This is the perfect time to add on another lot if you have the available capital without over-leveraging your account.

Some traders don't want to add on at higher prices because it adversely affects their dollar cost average. However, what traders need to realize is that markets trading higher tend to trend higher, and the opposite is true for bear markets. If you find yourself in a great winning trade, and you see no reason why it should stop, that is a great time to add on. When it comes to trading, you want to buy high and sell higher, or sell low and buy lower. We are not in the business of picking bottoms and tops. It is a one-way ticket to trading failure.

Successful traders also use stops. As the market moves in their favor, they move their stop up to where they feel is below a reasonable support level. They are comfortable with the losses or profits they will take if they get stopped out. They let the market tell them if they are right or wrong and they accept the market's decision!

Find a Broker Who Can Help You When You Need It Most

If you are having difficulty with adding to losing positions, you need to talk to your broker about it. Regardless if you are a self-directed online trader or broker-assisted, you need to have a talk with your broker. If you don't have access to a broker with your current trading arrangement, consider finding a firm that will allow you to access to one regardless of whether you are a self-directed online trader or broker-assisted trader.

As a Senior Broker at Daniels Trading, I can honestly tell you from first hand experience how important it is to be able to work through these situations with someone who has an interest in the success of your trading. Sometimes we are able to offer valuable advice about not adding to losing positions. Sometimes it just helps for the trader to talk about the trade the same way a person tells their psychologist their problems. In the end, it is the trader who works out what needs to be done just by communicating the situation aloud to another human being. Either way, having a trained professional in the weeds next to you during battle can make a huge difference in your most difficult trading periods, and help you make sure you never return to that place again.

#Article from FutureSource.com

Wednesday, November 10, 2010

CPO Commentary

News Bites

* Market Talk: Cargo surveyors ITS and SGS are scheduled to release their Malaysian palm oil export estimations for first 10 days of November today. Investors revised forecast for exports to 393,000 tons from 410,000 tons. ITS pegged the figure for November 1-10 period at 395,015 tons and SGS pegged the figures at 392,828 tons.

Outlook

* Fundamental: We expect CPO prices are likely to continue its upward momentum as fueled by other agricultural commodities. Watch forMPOB data due today.

* Technical: CPO futures broke out the observed high of 3348 yesterday, confirmed a continuation of the current daily Elliott primary impulse wave 3 which coincided with weekly cycle impulse wave 3 with an upside target of 3385 this week.

The RSI readings for hourly, daily and weekly timeframes are again overbought at their 80s. Any further upward momentum toward 3385-3400 vicinity will likely to trigger critical overbought condition for short-term timeframes and lead to a technical correction. Traders are advised to trade cautiously along the hourly uptrend channel of 3179 and 3382.

#Courtesy Inter-Pacific Securities Sdn Bhd, for enquiries please contact 03-21427586 or email :- tanks@interpac.com.my (please mention my site http://www.fkli.co.cc/ when enquiring)

Tuesday, November 9, 2010

My Small Account... Not Big Account ya Fred.. heheh

* I post this for inspiration to all traders that follow my trades and also for others as motivation, this from my small account trades..

>> 1st May 2010 monthly statement after badly injured by the market..


>> 31st October 2010 monthly statement


>> As yesterday 8th November 2010..


* I can only say believe in your system...

CPO Commentary

News Bites

* Market Talk: Market expected palm oil inventories in October to reach a nine month high of 1.85 million to 1.9 million tons on higher output and weak exports. Meanwhile production was expected to have increased 8%-15% at 1.7 million – 1.8 million tons and imports from Indonesia might reach 100,000 tons.

Outlook

* Fundamental: We expect technical to take precedence today as market awaits the MPOB data scheduled to be released tomorrow.

* Technical: CPO futures again touched a new 28-month high of 3308 in tandem with bullish daily indicators and settled at 3273 yesterday. We however believe the price target for daily Elliott primary impulse wave 3 had accomplished, prices should penetrate lower for a start of primary corrective wave 4 in the near term. This is also mirror the daily minor corrective wave 4 with first downside target of 3137, then 2789, downside target for primary corrective wave 4.

The daily and weekly RSI readings are currently overbought at their 80s, indicating prices may anticipate a short-term correction in the near-term. We would suggest scale up selling with a stop loss at observed high of 3308. Note that, any breakout above 3308 will indicate a continuation of the daily primary and minor impulse wave 3 and prices may jump higher to test the next psychology resistant at 3400.

#Courtesy Inter-Pacific Securities Sdn Bhd, for enquiries please contact 03-21427586 or email :- tanks@interpac.com.my (please mention my site http://www.fkli.co.cc/ when enquiring)

Monday, November 8, 2010

CPO Commentary

News Bites

* Market Talk: Renowned analyst Dorab Mistry said CPO futures may hit RM3300 in the next few weeks on weather concerns as back-to-back transition from El Nino to La Nina has caused severe imbalances and as weak dollar triggers funds pouring into commodities as inflation hedge. He expressed concerns that RM3300 a ton of palm may not be sufficient to ration demand as market may require higher prices in December and January to prepare for the tightness between February to May 2011. He added that world demand and supply is very tight even with current production estimates from Brazil and Argentina, thus any loss due to La Nina will make it tighter. He expected Argentine soyoil may rise as much as 10% to $1250 per ton.

Outlook

* Fundamental: We expect prices to move higher as fuelled by higher crude oil and soyoil prices.

* Technical: CPO futures broke out the hourly ascending triangle of 3106 and touched a new 28-month high of 3210 last Thursday. There are no major changes in the bullish daily indicators and prices continue to ride on the weekly Elliott impulse wave 3 with a target of 3241, Fibonacci ratio of 2.618 of wave 1, in the near term based on the Elliott wave principle.

The RSI readings for hourly, daily and weekly timeframes are currently overbought at 80, 76 and 78 respectively. Any further buying momentum toward 3241 will likely to trigger the extreme overbought RSI condition and lead to a technical correction, coincide with the start of weekly Elliott correction wave 4. Traders are advised to hold on their long position unless any signs of toppings. Note that, an extension wave 3 is always possible based on Elliott wave principle.

#Courtesy Inter-Pacific Securities Sdn Bhd, for enquiries please contact 03-21427586 or email :- tanks@interpac.com.my (please mention my site http://www.fkli.co.cc/ when enquiring)

An Introduction To CANDLESTICKS, PART 3

PART 3

Supply and Demand

A stock's price will adjust to higher or lower prices based strictly on
supply and demand principles.
In Figure 7 is shown a diagram of a green candlestick.

The green color of the candlestick indicates that the closing price of the
stock at the end of the day is higher than the opening price at the
beginning of the day.

Figure 7

As you will see, the candlestick's color and size provide very important
clues regarding the TRADER'S SENTIMENT toward a given stock's
future price.

Notice that 'trader's sentiment' is the key phrase here. In short term
trading, it is critical for the trader to have a clear understanding of
what other traders are thinking. As you will see, the most direct way to
get that understanding is through proper interpretation of the
candlestick.

Let's look at an example. In Figure 8 is shown a candlestick of XYZ
Company, which opened at 25 and closed at 25 3/8.

Figure 8

The candlestick is green in color, which gives us a quick visual signal
that the stock price has rallied higher during this period.

How can we use this information to help us understand what other
traders are thinking? To answer this question, we will follow the
candlestick's changes step by step to understand the mechanism which
is driving the stock price to move higher.

In Figure 8, we see the stock opens at 25, and then quickly rallies to 25
1/8. The reason the price moves to 25 1/8 is because there is a high
demand to buy the stock at 25 1/8, and a short supply of sellers
offering stock at 25 1/8.

Once all of the stock available at 25 1/8 is snatched up, the next group
of sellers steps up to offer their stock at 25 1/4.
All of the 25 1/4 stock is quickly snatched up because there are still a
larger number of traders willing to buy at 25 1/4 than sellers willing to
sell stock at 25 1/4.

Once the 25 1/4 stock is gone, the next group of sellers steps up to
offer their stock at 25 3/8. The 25 3/8 stock is quickly snatched up
too.

This process will repeat itself until the buyers loose interest in buying
the stock resulting in a reduction of demand.

The result of combining these steps is a green candlestick with an
opening price of 25, rallying to a closing price of 25 3/8.

During the rally period; however, the astute candlestick reader will be
able to observe the long green color of the candlestick, and deduce that
buyer demand is high.

Now there is only one reason why traders would increase demand by
stepping up to buy the stock, and that is because they think that the
stock will go up in the
near future. So by observing the candlestick color and size, the astute
candlestick reader is able to deduce exactly what other traders are
thinking, and that is that they think the stock price will go higher in the
future.

In Figures 9 & 10 we show an example of how the same principle in
reverse applies to the analyses of a red candlestick.

Figure 9

The red color of the candlestick indicates that the closing price of the
stock at the end of the day is lower than the opening price at the
beginning of the day.

In Figure 10, we see the stock opens at 25 3/8, and then quickly drops
to 25 1/4.

Figure 10

The reason the price moves to 25 1/4 is because there are many sellers
looking to unload there stock at 25 1/4, and a low number of buyers
willing to buy at 25 1/4.

Once all of the buyers have bought the stock at 25 1/4, the next group
of buyers steps up to bid for stock at the lower price of 25 1/8.

The desperate sellers quickly sell all of the stock at 25 1/8, and then
the next set of buyers step up at the price of 25.

This process will repeat itself until all of the sellers have unloaded all of
the stock that they want to sell, resulting in a reduction of supply.

The result is a red candlestick with an opening price of 25 3/8, falling to
a closing price of 25. During the stock's price fall; however, the astute
candlestick reader will be able to observe the long red color of the
candlestick, and deduce that demand for the stock is low.

Now there is only one reason why traders would increase the supply of
stock to sell, and that is because they think that the stock will go down
in the near future.

So by observing the candlestick color and size, the astute candlestick
reader is able to deduce exactly what other traders are thinking, and
that is that they think the stock price will go lower in the future.

Thursday, November 4, 2010

Weekly Update & Happy Deepavali

I wish my hindu friends and readers a very Happy Deepavali and may your wish come true :))

OK, now for my weekly update >>

*FKLI still holding LONG 1505 for November month.. (initial entry LONG 1308 on 30th June 2010 n still going strong roll roll roll..) with unrealised profit stands at 208 +/-

*CPO same case still holding January contract LONG 3052.. (initial entry LONG 2736 on 27th September 2010 n still rolling.. kkekekek) hit 3210 today n unrealised profit stands at 474 +/- almost 500 points winning... my aim cpo to hit 3750 +/-.. we wait and see yaa... dont follow me ya or i'll bring you all to HOLLAND!!

I FEEL GOOOOOOOOOOOOOOOOOOODDD .. heheh

Wise Words from Ed Seykota

If I am bullish, I neither buy on a reaction, nor wait for strength; I am already in. I turn bullish at the instant my buy stop is hit, and stay bullish until my sell stop is hit. Being bullish and not being long is illogical. ~ "Market Wizards, Interview with Top Traders - Jack D. Schwager"

*that what i can describe about the way I trade, almost almost similar with what Ed Seykota says.. cool :))

Tuesday, November 2, 2010

Will Gold Reach $5,000 Per Ounce?

Why The Founder Of The Second Largest Gold Mining Company In The World Says That Gold Will Reach $5,000 Per Ounce!
By Richard Rockwell

If the price of gold rising to $5,000 sounds far fetched to you, you may remember it probably sounded just as far fetched for gold to go over $1,000 per ounce back in 2001...

Gold Chart

There are 5 fundamental reasons that gold will go that high...and possibly higher!

1) Inflation

If you weren't one of the lucky ones back in 2001 to get the message and see returns of 400% on gold, hang on because this next run could allow you to easily make up for that missed opportunity MANY times over. With the worldwide Central Banks have rolled out an unheard of $12 Trillion Dollars in Stimulus programs and more than DOUBLED the US money supply! Never before in US history has there been such a massive paper print that could put the final nails in the US dollar's coffin. Remember the relationship with the Dollar vs. Gold? When the dollar is weakened what happens to gold? It goes UP, UP, UP!

2) Demand

You aren't the only one receiving this knowledge; the writing is on the wall. Investors and hedge funds alike are gobbling up more gold in more huge quantities than ever before. For those in the US that are still asleep at the switch, watch out investors in India will buy whatever you don't want. Let's not forget China, who is not shy about telling it's citizens to invest in all of the gold and silver they can afford. Can you say a BILLION people? So here's the lesson from Economics 101. When Demand increases and SUPPLY DECREASES, what happens to the PRICE? Elementary my dear Watson!

) Follow The "Smart Money"

Have you heard the phrase "If you want to be rich, copy what the rich invest in" So what are the richest people in the world investing in? Drum roll please...You got it, GOLD! Black Rock Inc. one of the largest investment mangers said that 2009 was the turning point...For the first time in over 20 YEARS the Central Banks have become Net BUYERS as opposed to Net Sellers of Gold.

4) Currency Crisis Coming

History (Fill in the blank)_______ itself. We have already seen what has happened to Portugal, Spain, Italy, Ireland, Iceland, and Greece. We have also seen the UK and countless other economies struggling. This is ALWAYS what happens with a currency that is only backed by the FAITH of the issuer. There has NEVER in the history of the world been a fiat (man made) currency that has survived...NEVER! If you're still out there thinking that the US Dollar can make a "comeback" with all that has happened, then you will be like the farmer that won't go into the root cellar thinking that the tornado heading for his house will certainly go around him! Again let me say NEVER in history has ANY fiat currency survived, and the US dollar will be no exception. If you do not have gold, what you will have will be plain and simple...paper and ink.

5) As Easy As 1,2,3

The move to $5,000 or more per ounce is sure to happen in 3 distinct phases, with each stage rapidly accelerating the previous one. Phase 1 Currency will continue to devaluate to almost nothing. HINT -- The US dollar has already lost 97% of its purchasing power since its inception! Phase 2 will be the strongest levels of investment demand the world has ever seen. By Phase 3, the price of gold will not move gradually, but rather TAKE OFF like each bar of bullion is strapped to a rocket! The price of gold today will seem like chump change in comparison!

CPO Commentary

News Bites

* Market Talk: CPO prices are likely to take a breather as weak export data points to higher stockpile level in October. Market expects palm oil inventory level to reach 1.85 million tons in October. However, concerns on annual monsoon which starts in November which might likely disrupt harvesting and lower palm output may limit the downside of prices.

Outlook

* Fundamental: We expect higher opening on overnight gains in crude oil and soyoil prices. Watch out technical for trade today.

* Technical: CPO futures broke out the hourly ascending triangle of 3086 and closed at 3092 yesterday, confirmed the short-term chart pattern with an upside target of 111 points at 3195 in the near term. Conversely, a daily spinning top candle formed yesterday, signifying prices are losing momentum and the bull may be in trouble particular when prices near its new high or during a rally. We however believe a confirmation candle to close below 3061, low of current spinning top candle, is required to confirm the reversal chart pattern.

We would advice on buying accumulation on technical correction with a stop loss at 3000, daily Parabolic SAR, and for those shorter term traders may put their stop level at 3061 as any convincing breakdown below the above said support may mean a pause to the current medium-term uptrend. Immediate resistant should refer to 3100 psychology level, then 3195, short-term target of hourly ascending triangle breakout on Nov 1.

#Courtesy Inter-Pacific Securities Sdn Bhd, for enquiries please contact 03-21427586 or email :- tanks@interpac.com.my (please mention my site http://www.fkli.co.cc/ when enquiring)

Monday, November 1, 2010

An Introduction To CANDLESTICKS, PART 2

PART 2

One of the main differences between the Western Line and the
Japanese Candlestick line is the relationship between open and closing
prices. The Westerner places the greatest importance on the closing
price of a stock in relation to the prior periods close. The Japanese
place the highest importance on the close as it relates to the open of
the same day. You can see why the Candlestick Line and its highly
graphical representation of the open to close relationship is such an
indispensable tool for the Japanese trader. To illustrate the
difference, compare the daily chart plotted with Western Lines (Figure
3) with the exact same chart plotted with Japanese Candlestick lines
(Figure 4). In the Western bar chart as with the Japanese Candlestick
chart, it is easy to interpret the overall trend of the stock, but note
how much easier it is to interpret change in sentiment on a day to day
basis by viewing the change in real body color in the Japanese
Candlestick chart.

Figure 3

Figure 4

Trader's sentiment

One of the greatest values of the candlestick chart is the ability to read
market sentiment regarding a stock. To illustrate consider the
following example of a stock traded from the eyes of a Western chart
trader and then from the eyes of a candlestick chart trader.

Western Chart Trader

At the close of the day's session you observe that the stock closed well above your entry price (2), which
leaves you very content with your trade.

After the close of day 2, you open the financial section of the paper and check the closing price of the
stock and observe that not only is your stock well above your entry price, but also has gained slightly (it is
worth mentioning
that most western papers only publish closing prices while Japanese papers publish both opening and
closing prices).

On day 3 you open and the newspaper to check the close and notice a slight dip in your stocks price but
you do not panic, because you are still well in the money.

You convince yourself that the stock has only dipped slightly relative to the entry day close (day 1), and
should resume its up trend on the next day.

On day 4, you check the close and notice that the stock has fallen significantly relative to the prior days
close.

You are now concerned about protecting the profits that you had previously bragged about just days
before.

On the beginning of day 6, you call your broker (or logon to your online trading account) and place a
market order to sell at the first opportunity.

At the day 5 markets open, the stock opens sharply lower and continues to fall.

Your order is executed at a price several points below where you entered.

You then shrug off the trade as an unpredictable misfortune, and move on to the next trade.

Figure 5

Candlestick Chart Trader

Now suppose you are a candlestick chart trader trading the same stock
using a candlestick chart (Figure 6).

At the beginning of Day 1 you enter the stock based on a candlestick
pattern entry signal (we will discuss proper entries in detail latter in
this unit).

At the close of the day's session you observe that the stock closed well
above your entry price (2) which leaves you very content with your
trade, but also moves you into a state of caution for signs of a change
in trend or reversal.

After the close of day 2, you observe the candlestick formed for the
day and notice that the real body is small indicating that there was a
tug of war between the bears and the bulls.

You also observe that the real body is read in color indicating that the
stock closed lower than the open indicating that the bulls actually lost
the tug of war to the bears.

Based on these observations you conclude that the bullish rally in the
stock has ceased, and the bullish sentiment of the market regarding
the stock is changing.

You decided to sell your position at the days close, or at the market
open on the next day to lock in your profit.

If this were a stock in the midst of an overall downtrend, you may
decide to short the stock under the low of the day 2 bearish
candlestick.

As you can see the candlestick chart trader has the advantage over
the western chart trader in that he can use the signals generated in
each candlestick to help foretell the changing sentiments of the market
regarding a stock.

The open to close relationship revealed in the candlestick is more
effective than the close-to-close relationship commonly used by
western traders.


Figure 6

CPO Commentary

News Bites-

* Market Talk: Continues talk has that October exports are likely to be steady, however exports in November should be higher due to the export levy set by Indonesia would made Malaysia palm oil the cheaper option to purchase. Moreover, China is likely to step up purchases for the Lunar New Year in February.

Outlook:

* Fundamental: CPO futures are likely to be supportive on bullish forecast and talk on higher export in November. Watch out export estimation due today.

* Technical: CPO futures corrected 24 points after an aggressive buying on Oct 28 and settled at 3068 last Friday. Note that, there is a formation of hourly ascending triangle in tandem with bullish daily indicators. Any breakout above 3086 will confirm the hourly ascending triangle breakout with 111 points price target at 3197 in the near term. With intradays’ RSI back to neutral ground, we would suggest on buying on technical correction with a tight stop loss at 3035, low of hourly ascending triangle, and for those shorter term traders to buy upon technical breakout above 3086. Should prices successfully cling on to 3086 level on closing basis today, prices may test 3100 psychology level. But should prices close below 3086, prices might likely continue consolidating within the range of hourly ascending triangle around 3035 and 3086 in the near term.

#Courtesy Inter-Pacific Securities Sdn Bhd, for enquiries please contact 03-21427586 or email :- tanks@interpac.com.my (please mention my site http://www.fkli.co.cc/ when enquiring)

Friday, October 29, 2010

FKLI roll day

*FKLI turn LONG 1505 for November month..(roll)

*CPO still holding January contract LONG 3052..

CPO Commentary

News Bites-

* Market Talk: Malaysia palm oil exports in October is likely to increase a tad by 2%-3% on month, while exports in November is likely to increase more as Indonesia's export levy would make rival Malaysia palm oil a cheaper alternative. Production is likely to taper off as seasonally high palm output period ended and annual monsoon season begins, which might prompt further decline in production and a drawdown in stockpile level.

Outlook-

* Fundamental: Expect CPO prices to be supportive on talk of higher export.

* Technical: CPO futures touched a new 27-month high again and settled at 3085 yesterday. The buying momentum also triggered hourly MACD into bullish mode and confirmed the breakout above the hourly “bull flag” of 2931 on Oct 27 with a short-term target of 3140 in the near term.

The daily, hourly and 15minutes RSI readings are however overbought at their 70s, indicating possible shortterm correction in the near term. Would suggest on buying accumulation after a correction on intradays’ RSI readings. Immediate support and resistance should refer to observed low of 3010 and 3100 psychology level, then 3140 to cap more upward momentum in the near term.

#Courtesy Inter-Pacific Securities Sdn Bhd, for enquiries please contact 03-21427586 or email :- tanks@interpac.com.my (please mention my site http://www.fkli.co.cc/ when enquiring)

Thursday, October 28, 2010

CPO Commentary

News Bites-

* Market Talk: Talk that chinese regulators moves to tightening trading rules to curb speculation and cool inflation in China, as well as likely weaker India edible oils imports may both place pressure on soyoil and palm oil market. A local broking house commented that CPO prices are likely to fall towards RM2,950 a ton in the near future due to the above given reasons.

Outlook-

* Fundamental: Expect selling pressure on bearish fundamental ahead. Watch for technical to trade.

* Technical: Another daily hanging man candle formed yesterday. A particular pattern signifying bullish reversal and prices are losing some upward momentum. The candle also alike bearish dragonfly doji pattern where opening and closing are nearly identical wihout an upper wick on top, a much stronger and reliable candle compare with hanging man offering bearish signal. note that, open interest for February contract jump 71.7% or 5512 lots from 7,686 to 13,198 lots while benchmark January contract only increased 4.2% or 1136 lots to 28,062 lots, likely indication traders are building up their position in February contract.

With mix technical indications, would expect prices to consolidate between 3010, low of Aug 27 , and 3084, high of Oct 25, pending any breakout to provide a clearer picture in near term.

#Courtesy Inter-Pacific Securities Sdn Bhd, for enquiries please contact 03-21427586 or email :- tanks@interpac.com.my (please mention my site http://www.fkli.co.cc/ when enquiring)

Tuesday, October 26, 2010

CPO roll roll roll day

*I decided to roll CPO today to January contract >> LONG 3052..

*FKLI still no difference maintain my LONG 1461 for October month..

An Introduction To CANDLESTICKS, PART 1

PART 1

AN INTRODUCTION TO CANDLESTICKS

Technical Analysis vs. Fundamental Analysis

There are two types of ways to analysis the price of a stock, fundamental
analysis, and technical analysis. Fundamental analysis is used to gauge the
price of a stock based on the fundamental attributes of the stock, such as
price/earnings ratio, Return on invest, and associated economic statistics.

Technical analysis deals more with the psychological component of trading a
stock, and is influenced for the most part on emotionalism.

The technical analyst is seeking to answer the question "how are other traders
viewing this stock, and how will that affect the price in the immediate future".

As you will see, the candlestick chart is the most effective way to gauge the
sentiments of other traders.

History of Candlestick Charts

The Japanese were the first to use technical analysis to trade one of
the world's first rice futures markets in the 1600s. A Japanese man by
the name of Homma who traded the futures markets in the 1700s
discovered that although there was link between supply and demand
of the rice, the markets were also strongly influenced by the emotions
of the traders.

Homma realized that he could benefit from understanding the
emotions to help predict the future prices. He understood that there
could be a vast difference between value and price of rice.

This difference between value and price is as valid today with stocks,
as it was with rice in Japan centuries ago.

The principles established by Homma in measuring market emotions in
a stock are the basis for the Candlestick Chart analysis, which we will
present in this seminar.

Candlestick vs. Western Charts

The Western bar chart is made up of four parts components, open,
high, low, and close. The vertical bar depicts the high and low of the
session, while the left horizontal line
represents the open and the right
horizontal line represents the close.

Figure 1

The Japanese Candlestick Line (Figure 2) uses the same data (open,
high, low, and close) to create a much more visual graphic to depict
what is going on with the stock. The thick part of the candlestick line
is called the real body. It represents the range between the session’s
opening and closing prices. If the real body is red, it means that the
close of the session was lower than the open. If the real body is
green, it means that the close was higher than the open. The lines
above and below the body are the shadows. The shadows represent
the session’s price extremes. The shadow above the real body is
called the upper shadow and the shadow below the real body is called
the lower shadow. The top of the upper shadow is the high of the day,
and the bottom of the lower shadow is the low of the day.

Figure 2

Sunday, October 24, 2010

Weekly update..

This week got nothing to update again.. hahahaha, still same position for both FKLI/CPO :))

*FKLI maintain my LONG 1461 for October month..

*CPO still holding December contract LONG 2736.. no rollover for me still..

Monday, October 18, 2010

50 reasons why you shouldn't be trading or even consider trading if...

1) you need the money
2) you hope to buy something from the paper winning in the trade you just made
3) you want to make a million bucks with 1 lot of a futures contract
4) you set a minimum profit target for the year
5) you don't want to lose
6) you never lost before in anything in your life; more like you bluffed yourself that you never lost
7) you offer people free market tips
8) your wife spends your profits and nags you about your losses
9) you graduated from Harvard or Yale or Princeton or Cornell with an economics or business degree
10) your financial blog is full of analysts reports that justify your positions even when you are losing like crazy
11) you don't allow anyone to post a contrary argument to your positions in your blog even though the market has proven those arguments correct
12) you brag a lot in other peoples blog on how you rob and pick pocket the markets but disappear when you are wrong big time
13) you criticise other traders for learning from books and say that you play by your own rules and still insist on averaging and holding on to your losses even though the market is in a super trend against you
14) you had a group of trading students whom you were teaching and they have now abandoned you
15) your ex-students are now trading successfully in markets you dare not trade and still dare not trade in
16) you thought you had a trading system, when in reality all you had was your hope and opinions
17) you've been called stubborn, egoistic or lansi lanyong too often
18) you think to accept losses is the same as to like losses
19) you think Singapore street food tastes better than Malaysia's
20) you think Ipoh Fried Kway Teow, Penang Laksa and Seremban Beef Noodles originated from Singapore
21) you know the names of all the footballers in the Malaysian football team
22) you have a new child but the last time you had sex with your spouse was over a year ago
23) you don't have a trading system and if you did ,you 2nd guess the signals
24) you don't know who Manny Pacquiao is
25) you think Floyd Mayweather Jr has balls
26) you pester and beg successful traders for their system
27) your charts are so full of indicators and lines that you can't see the price bar at all
28) your charts are so full on indicators and lines and you still don't follow it
29) you say that you'll fight the market because a few lots won't kill you
30) you want to impress a girl/guy/bapok
31) you talk about trading to your non trading friends so often that you suddenly realise that you have no real friends left and the people that hang around you now only want to borrow money from you or get a free lunch
32) you always blame others for your mistakes
33) you are a white skin worshipper
34) you invest in unit trusts
35) you can't think of any other uses for palm oil except as cooking oil and bio-diesel
36) you equate successful trading with passing exams with flying colors
37) you support Liverpool FC even when it's in the relegation zone
38) you think the voice behind Bart Simpson is a guy
39) you find Venus and Serena Williams attractive
40) you hero worship Mao Zedong
41) you are for the return of Chin Peng to Malaysia
42) you still buy 4D,5D,6D and Toto
43) your second home is the casino
44) your second home is the pub
45) you named your sons or dogs Jack ,Jim,Johnnie or Sahib
46) you spend more than what you earn
47) you are about to undergo brain surgery
48) you are about to undergo open heart surgery
49) you listen and followed the advice of Tun Dr. Mahathir not to cut your losses during the stock market crash of 1997
50) you find this article irritating and feel like killing me because I have just described YOU!

Saturday, October 16, 2010

Weekly Update..

*FKLI maintain my LONG 1461 for October month..

*CPO still holding December contract LONG 2736.. no rollover for me yet.. :)

Wednesday, October 13, 2010

A few behavioural traits of a confused/bad speculator

In my many years of trading securities and futures, I've come across many or almost all, bad traders. They could be the ordinary jo in the gallery or the chief dealer in a big firm and the thing that catches my attention is that all of them share a lot of similar traits; not necessarily all the traits but a lot of similarities.
So here are some of the most common traits of bad traders which I noticed:

1) they spend paper profits.
Illogical as it may seem, this is the most prevalent trait among people with poor emotional control. I think most of you will realize the same thing if you think about it. How many traders(or even yourself) do you know suddenly increase their spending pattern during a bull run? They could be more lavish in their meals, change a new car, change to more expensive perfumes, more expensive in their dressing or even keep a mistress. When I ask them whether they have liquidated their positions; the answer is always unanimously 'not yet'! ..There's more, they'd be so full of themselves that they even declare that they'll make it no matter what the market condition and most of these fellas are stock traders in Bursa(Bursa being a 1 way market only)! This only shows that people do not need to be rich before they 'upgrade' themselves,they only need to feel rich!
A contrasting example would be my very succesful trading buddy Tom: he naturally liquidates the portion of his positions to pay for his Camry , an Altis for his wifey and a 3 week European holiday for himself, wife and his in-laws ;all paid for in cash.. my only gripe with him is why take his in-laws along? Sorry tommy..i can't help myself.

2)they are sexually active only when there are winning real or on paper.
Lo and behold, I broke the taboo subject that most of you don't want to admit! Think about it, bad traders are only sexually active when they get lucky in the markets! They think they are great and they go all out to conquer another person to fuel their ego of being so smart in making a rare win. They good traders (very few) whom I know personally are only sexually active when they are in a losing streak! Maybe this behavior can be explained that winning traders get their high from winning and don't need any external stimulation to cut down their high..after all,sex is more mental than physical and so too is trading. Lesson to be learnt here? Good lovers are actually lousy traders..LOL!

3) they have no life outside of the markets.
They would be restless when the market is on holiday,they'd look at charts the whole time or be drinking themselves drunk just so the holiday would past by. They would talk about the market to every person they meet showing off their limited knowledge that they possess. Or they'd go around asking for tips and tits! If they could,they'd want to trade 7 days a week.
Contrast this with the good,excellent or fantastic traders I've come across; They have a balanced life and are very passionate with their hobbies and family. They have other goals in life and look forward to a break to catch up with their other passion. Gt is passionate with his family and with his hobby of flying remote control planes and helicopter. Lesson to be learnt here; GET A LIFE!

4) they subscribe to analyst reports.
All the good traders whom I personally know NEVER bother reading analyst reports let alone subscribe to it...not even the Wall Street Journal or even Fortune magazine. But they do read good trading books like 'Reminiscences...', Market Wizards etc. Why then bad traders rely on so many news and reports while the best don't even bother? Confidence; the best knows that no one knows what the future holds. Some more,why bother paying for someone else's opinion when you can get it free in some bad traders blogs? But ask yourself this, if analysts are so sure of their reports,don't you think they'll sell everything they possess and trade? Think about it, how many analyst do you know gets fired for writing a wrong report or a series of wrong reports? Lesson here: if you want opinions ,get it FREE!

5)they never learn from their mistakes.
History repeats itself all the time and that's why we study it. How many traders do you know actually study their mistakes and try their level best not to repeat it? Or how many traders do you know keep on repeating their mistakes over and over again? Like getting wiped out more than once? It's hard to accept your mistakes more so if you have an over inflated ego. I guess that's why so few make it in this game called speculation ,but a lucrative game for those living off people's mistakes.

This is also not a conclusive traits of bad confused traders, just a few traits that are most common among them. Think about it, does it apply to you? If it does,then do something about it like STOP trying to impersonate a trader.

Tuesday, October 12, 2010

FKLI & CPO Update

*FKLI maintain my LONG 1461 for October month..

*CPO also same story, still holding December contract LONG 2736..

Thursday, October 7, 2010

The many 'don't 'of intelligent speculation

Many a time I've been approach by friends who want to speculate in the futures markets and I always give them my copy of 'Reminiscences of a stock operator' to read 1st. If the book is not read within 1 week, I would then ask them to return back my book and tell them plainly in their face not to waste their time even to think that they can trade.
This is a hard and cruel game and you need a passion for it. But let's see how many people can be passionate about this game after reading and pondering about the 'DON"T' of speculation. Why do I start of with the 'don't' of speculation ? Because it's the most common and basic mistakes made by every beginner when they place their 1st trade.

DON"T #1 : Don't ever over trade.
This year we've come across bloggers and traders who have suspended themselves from trading for one reason or the other. My deduction is that they were over trading. What is over trading? Over trading is mainly trading with insufficient capital. What is sufficient capital? Let's take the example of CPO ,the margin requirement is RM4,ooo per lot. That means you need a minimum of RM4,000 to trade 1 lot of CPO. If you follow gt's 30% rule;you need a minimum of RM 14,000 in your trading account to trade 1 lot of CPO. But how many actually keep to such a rule? I've seen many gallery traders who trade CPO with RM5-7,000 per lot.Needless to say,they don't last long after 1 or 2 whips from the market.

DON"T # 2: Don't increase your trading position after a loss or a series of losses.
This is quite a normal thing for gamblers to do,they increase their positions every time they lose thinking that their losing streak will end soon and they get to cover all their losses in 1 hand. But how many actually know when their losing streak will end? What if the markets whips u 10 times in a row? DO you think you still be around to catch the big move in your favor? This is also a form of over trading.

DON"T # 3: Don't ever fight the trend because of your opinions.
There is a blogger (still blogging by the way) who is and I believe is still fighting FKLI by being short and even shorting higher. He quotes 'who says there is only 1 road to Rome?' . But the surest and fastest way to Holland is by being stubborn and egoistic by fighting the market! IF you think you are smart and intelligent and therefore you must be right all the time why then do you not find or even hear of Albert Einstein or Professor Stephen Hawking trading for a living even on a part time basis, since they are sooooo smart and their opinions are definitely better than yours or mine? Think about it? You think you are smarter than Einstein or Professor Hawking?

DON'T # 4: Don't ever talk about your trades with other traders.
Trading is an egoistic game,chances are if you ever talk to someone that someone will talk you out of your position;since egoistic people always want to justify that they are always right! If they can't talk you out of your position with charts ,they'll probably talk you out of it by showing you negative analyst reports or projected gloom in the economy or market. Remember, all analyst reports and projections are just opinions of the author!

DON'T # 5: Don't ever talk about trading to your non-trading friends or family.
This is the fastest way to lose friends as they'll think that you are either a braggart or a gambler.
You must see it from their point of view,it's damn boring and most inexperienced traders get carried away as they'll go on and on and on about their trades or system and will start dominating the conversation. People will avoid you the same way people avoid direct selling recruiters or pesky life insurance agents trying to load you up with policies you can't afford! But do talk trading to people you don't like ;it's a classy way of getting rid of them from your life!

DON"T # 6: Don't be a fulltime trader/speculator if 30% gain a year on your capital is less than what you are making now.
Serious, it blows my mind wondering why people even decide to trade on a full time basis when they are already holding on to decent jobs. But honestly,30% gain is a conservative figure to speculators,but how sure are you that you'll even come out ahead for the year? Most part time traders don't realize that the reason they are doing spectacularly year in year out is because of their full time job. Losses will affect you no matter what people say and losses without a full time job will affect you even more. You'll never realize just how many tricks your mind can play with you.

This list of 'don't' is not exhaustive but I think I've covered the basics . Now it's all up to you to really be honest with yourself. If I offended anyone,don't take it personally but just ponder about it.

By the way,I'm not taking in new students but the door is still open for oops n nb..since I left them too abruptly! So oops and nb do send me your email address if you want to continue your education.

Saturday, October 2, 2010

Weekly Update FKLI & CPO

*FKLI now holding Long 1461 for October month (roll)..

*CPO still holding December contract LONG 2736..

ps>> for those not believers that our market damn strong and still holding FKLI Shot position, i wish good luck shorting to AVERAGE HIGH your position, watch/search this movie about Nick Leeson, dont go against the trend, the name of the movie -->> ROGUE TRADER :), maybe you guys (i mean shorties) will learn something.. Good weekend to all.. adios

Friday, October 1, 2010

Test your skill/system trading..

*You discover a super system to trade, try this website www.chartgame.com to test your "PROVEN" system to trade the market. The chart taken from real stocks traded in US/Canada, your system will compete with Buy & Hold system set by the website.

*This is my game record using my system.. hahahhaah, damn bored now playing chart games..

Thursday, September 30, 2010

FKLI

*FKLI rolling day, continue LONG 1461 for October month.. good profit for September :) and officially i'm back in the black (up 50pts +/-) for this year 2010, looking forward to close FKLI this year on positive note after total heart ache for the first 6 month of the year.

Monday, September 27, 2010

CPO

*CPO turn LONG 2736 for December contract.. hmmm heavy losses for November contract, haihh

Friday, September 24, 2010

Weekly update FKLI & CPO

As expected i got nothing to post or update for past 1 week, so here goes my position again.. NO CHANGE..

*FKLI still holding firmly my September roll LONG 1426.5..

*CPO also same case, still maintain my NOV contract SHOT 2624 but looks like as i post in my cbox earlier today i going to get slaughtered by the market soon because as i typing this update, Soybean Oil jumping like shit about 2% up... knn fred hahahaha

Friday, September 17, 2010

Unit Trust vs Stock Market

Taken from : RHBInvest's forum

Written by : "I smell money"

Don't know if you guys notice this, but everyone with investment in unit trust need to take note of this. I've recently flipped through the newspaper to have a check on performance of unit trust (according to Lipper Ranking) and these are some of the findings:

1.For the 6 months period [26-02-10 - 27-08-10], the common benchmarks FBM KLCI index rose +12.8% and FBM100 rose +12.4%. However Malaysian equity funds (non-islamic) had only return +8% on an 80-member average. {WHOA!!! not too impressive return by an average fund manager}.

2. Ok, then lets look at how many of the funds beat the benchmark of 12%. Oppss .. only 10 out of 80 fund or 12.5% of fund managers beat their benchmark.

3. Ok, then we shall look at the creme de la creme of the group, and see how they have done. For the top performing fund for the 6 month category, the top fund only had a return of 15%, huhhhh!!! only 3% above the benchmark.

Ok. then its time to compare this with some of the markets 2010 favourite.

Comparison same period
1. Supermax 12% (even after it had fallen off the cliff towards the end of July)
2. TimeCom 29%
3. Axiata 19%
4. Jadi 65% (ok this one a bit too unrealistic, but if you went in around XXsen when the stock was heavily traded)
5. AirAsia 14%
6. JCY -29% (of course not everything is hunky dory, and how can anybody forget about this name)
7. Unisem 19%
8. Notion -45% (woooo, dont we hate this name)
9. UEMLand 40%
10. MRCB 21%
11. Adventa -27%
12. Talam -20%
13. BJ Corp -23%
On average +37.5% (if you spread your money across all the 13 stocks evenly).


So if anyone who wants to invest in the stock market through unit trust then they should reconsider this strategy.

*Thanks to Teh (http://cpteh.blogspot.com) for allowing me to borrow/publish his article here.

Wednesday, September 15, 2010

CPO & FKLI

*CPO turn SHOT 2624 today but still maintain November contract.. i not interested to trade December contract yet!!

*FKLI still same case still holding September month LONG 1426.5..

Thursday, September 9, 2010

Selamat Hari Raya & Weekly update..

I wish to all reader/followers of my blog here Selamat Hari Raya & Happy Holidays to all :)) and to those SHORTIES for FKLI & CPO good luck going against my position.. hik hik hik

*FKLI still holding September month LONG 1426.5..

*CPO also same case still maintain November contract LONG 2557..

Saturday, September 4, 2010

Weekly Update

Not much to do, so this is my current position..

*FKLI still holding September month LONG 1426.5..

*CPO maintain November contract LONG 2557..

Monday, August 30, 2010

FKLI & CPO

*FKLI roll to September month LONG 1426.5..

*CPO maintain November contract LONG 2557..

Friday, August 27, 2010

CPO & FKLI

*CPO turn SAR LONG 2557 for November contract..

*FKLI still holding LONG 1354 for August month..

Update FKLI & CPO

Nothing to update actually, so this is my current position..

*FKLI still holding August LONG 1354..

*CPO maintain SHOT 2652 November contract..

Tuesday, August 17, 2010

CPO & FKLI

*FKLI still holding August LONG 1354..

*CPO turn SHOT 2652 November contract..

Friday, August 13, 2010

Weekly update FKLI & CPO

*FKLI still holding August LONG 1354..

*CPO maintain October LONG 2445, no rollover for me... :))

Monday, August 9, 2010

Weekly update FKLI & CPO

*FKLI still holding August LONG 1354..

*CPO maintain October LONG 2445..

Friday, July 30, 2010

FKLI & CPO (Weekly update)

*FKLI roll today at close, so holding LONG 1354 for August..

*CPO still holding October contract LONG 2445..

Saturday, July 24, 2010

Weekly update..

*FKLI still holding LONG 1308..

*CPO maintain October contract LONG 2445..

Tuesday, July 20, 2010

CPO & FKLI

*CPO I decided to roll today, very good deal rolling.. hahahaah.. so now holding October LONG 2445..

*FKLI btw remain the same, holding LONG 1308..

Weekly update

*FKLI still maintain holding LONG 1308..

*CPO maintain hold September contract LONG 2321, no rollover to October..

Wednesday, July 14, 2010

CPOTrader retired/pencen from trading????

*halo to all.. i just knew that one of futures bloggers already stop trading for this year.. 2010 is really a tough year for most of trend followers for fkli.cpo .. i wish good luck to CPOTrader.. for me i'll strive to continue trading with "ROJAK" system.. no doubt i'm also ROCKed by the market n just surviving now... 5month to go b4 year end.. if my system manage to "TACKLE" any good movement towards year end , MAYBE.. YES MAYBE i can close book for 2010 with profit.. all the best to all & GOOD LUCK... :))

Monday, July 12, 2010

CPO & FKLI

*CPO turn LONG 2321 for September contract...

*FKLI still maintain LONG 1308...

Friday, July 9, 2010

FKLI &CPO

^oo^... nothing to update... no i c.. still holding FKLI LONG 1308 & CPO SHOT 2373 for September contract...

CPO 2011 (GT2 System Performance)

MAY 2011 contract
1)17.02>LONG 3729-SELL 3623 = -106 (21.02)

2)21.02>SHOT 3623-BUY 3538 = +85 (23.02)

3)23.02>LONG 3538-SELL 3518 = -20 (28.02)

4)24.02>SHOT 3506-BUY 3413 x 2lots = +186 (24.02)

5)28.02>SHOT 3518-BUY 3525 = -7 (01.03)

6)01.03>LONG 3525-SELL 3625 = +100 (08.03)

7)08.03>SHOT 3625-BUY 3598 = +27 (09.03)

8)09.03>LONG 3598-SELL 3406 = -192 (11.03)

9)10.03>SHOT 3501-BUY 3473 x 2lots = +56 (10.03)

10)11.03>SHOT 3406-BUY 3347 = +59 (14.03)

11)14.03>LONG 3347-SELL 3371 = +24 (15.03)

JUNE 2011 contract
12)15.03>LONG 3360-SELL 3434 = +74 (21.03)

13)21.03>SHOT 3434-BUY 3347 = +87 (23.03)

14)23.03>LONG 3347-SELL 3425 = +78 (11.04)

15)24.03>SHOT 3287-BUY 3249 x 2lots = +76 (24.03)

16)31.03>SHOT 3302-BUY 3343 x 2lots= -82 (31.03)

17)05.04>SHOT 3368.5-BUY 3365 x 2lots= +7 (05.04)

18)07.04>SHOT 3339-BUY 3342 x 2lots= -6 (07.04)

19)11.04>SHOT 3425-BUY 3344 = +81 (13.04)

20)13.04>LONG 3344-SELL 3307 = -37 (14.04)

21)14.04>SHOT 3307-BUY 3269 = +38 (18.04)

JULY 2011 contract
22)18.04>LONG 3253-SELL 3355 = +102 (25.04)

23)19.04>SHOT 3220-BUY 3240 x 2lots = -40 (19.04)

24)25.04>SHOT 3355-BUY 3334 = +21 (26.04)

25)26.04>LONG 3334-SELL 3290 = -44 (27.04)

26)27.04>SHOT 3290-BUY 3320 = -30 (28.04)

27)28.04>LONG 3320-SELL 3243 = -77 (04.05)

28)04.05>SHOT 3243-BUY 3277 = -34 (05.05)

29)05.05>LONG 3277-SELL 3175 = -102 (06.05)

30)06.05>SHOT 3175-BUY 3203 = -28 (09.05)

31)09.05>LONG 3203-SELL 3264 =+61 (10.05)

32)10.05>SHOT 3264-BUY 3252 = +12 (13.05)

33)13.05>LONG 3252-SELL 3370 = +118 (19.05)

AUGUST 2011 contract
34)19.05>LONG 3339-SELL 3388 = +49 (23.05)

35)23.05>SHOT 3388-BUY 3385 = +3 (24.05)

36)24.05>LONG 3385-SELL 3370 = -15 (25.05)

37)25.05>SHOT 3370-BUY 3386 = -16 (25.05)

38)25.05>LONG 3386-SELL 3418 = +32 (26.05)

39)26.05>SHOT 3418-BUY 3439 = -21 (26.05)

40)26.05>LONG 3439-SELL 3405 = -34 (26.05)

41)26.05>SHOT 3405-BUY 3442 = -37 (27.05)

42)27.05>LONG 3442-SELL 3440 = -2 (30.05)

43)30.05>SHOT 3440-BUY 3373 = +67 (02.06)

44)02.06>LONG 3373-SELL 3441 = +68 (03.06)

45)03.06>SHOT 3441-BUY 3254 = +187 (13.06)

46)13.06>LONG 3254-SELL 3256 = +2 (16.06)

SEPTEMBER 2011 contract
47)16.06>SHOT 3254-BUY 3215 = +39 (20.06)

48)20.06>LONG 3215-SELL 3212 = -3 (22.06)

49)22.06>SHOT 3212-BUY 3178 = +34 (23.06)

50)23.06>LONG 3178-SELL 3144 = -34 (24.06)

51)24.06>SHOT 3144-BUY 3121 = +23 (24.06)

52)24.06>LONG 3121-SELL 3076 = -45 (27.06)

53)27.06>SHOT 3076-BUY 3080 = -4 (28.06)

54)28.06>LONG 3080-SELL 3113 = +33 (30.06)

55)30.06>SHOT 3113-BUY 3071 = +42 (04.07)

56)04.07>LONG 3071-SELL 3054 = -17 (04.07)

57)04.07>SHOT 3054-BUY 3046 = +8 (06.07)

58)06.07>LONG 3046-SELL 3074 = +28 (08.07)

59)08.07>SHOT 3074-BUY 3045 = +29 (12.07)

60)12.07>LONG 3045-SELL 3115 = +70 (15.07)

61)15.07>SHOT 3115-BUY 3134 = -19 (18.07)

OCTOBER 2011 contract
62)18.07>SHOT 3125-BUY 3082 = +43 (19.07)

63)19.07>LONG 3082-SELL 3140 = +58 (21.07)

64)21.07>SHOT 3140-BUY 3100 = +40 (25.07)

65)25.07>LONG 3100-SELL 3115 = +15 (28.07)

66)28.07>SHOT 3115-BUY 3123 = -8 (28.07)

67)28.07>LONG 3123-SELL 3086 = -37 (29.07)

68)29.07>SHOT 3086-BUY 3100 = -14 (29.07)

69)29.07>LONG 3100-SELL 3120 = +20 (02.08)

70)02.08>SHOT 3120-BUY 3137 = -17 (03.08)

71)03.08>LONG 3137-SELL 3116 = -21 (04.08)

72)04.08>SHOT 3116-BUY 3050 = +66 (05.08)

73)05.08>LONG 3050-SELL 3033 = -17 (08.08)

74)08.08>SHOT 3033-BUY 2959 = +74 (09.08)

75)09.08>LONG 2959-SELL 3004 = +45 (12.08)

76)12.08>SHOT 3004-BUY 3054 = -50 (15.08)

77)15.08>LONG 3054-SELL 3057 * = +3 (15.08) *sell because chart hang from 3pm.

NOVEMBER 2011 contract
78)16.08>SHOT 3019-BUY 3025 = -6 (17.08)

79)17.08>LONG 3025-SELL 3003 = -22 (19.08)

80)19.08>SHOT 3000-BUY 3045 = -45 (23.08)

81)23.08>LONG 3045-SELL 3051 = +6 (24.08)

82)24.08>SHOT 3051-BUY 2978 = +73 (26.08)

83)26.08>LONG 2978-SELL 3037 = +59 (05.09) #NO TRADE because raya holiday!!

84)05.09>SHOT 3037-LONG 3007 = +30 (06.09) #NO TRADE because of Bursa feed problem!!

85)06.09>LONG 3007-SELL 3032 = +25 (08.09)

86)08.09>SHOT 3032-BUY 3055 = -23 (09.09)

87)09.09>LONG 3055-SELL 3021 = -34 (13.09) *

88)13.09>SHOT 3021-LONG 3023 = -2 (14.09)

89)14.09>LONG 3023-SELL 2993 = -30 (14.09)

90)14.09>SELL 2993-BUY 3009 = -16 (14.09)

91)14.09>LONG 3009-SELL 3038 = +29 (19.09)

DECEMBER 2011 contract
92)19.09>LONG 3038-SELL 3028 = -10 (22.09)

93)22.09>SHOT 3028-BUY 2915 = +113 (26.09)

94)26.09>LONG 2915-SELL 2886 = -29 (28.09)

95)28.09>SHOT 2886-BUY 2898 = -12 (29.09)

96)29.09>LONG 2898-SELL 2826 = -72 (04.10)

97)04.10>SHOT 2826-BUY 2775 = +51 (06.10)

98)06.10>LONG 2775-SELL 2783 = +8 (07.10)

99)07.10>SHOT 2783-BUY 2866 = -83 (12.10)

100)12.10>LONG 2866-SELL 2838 = -28 (13.10)

101)13.10>SHOT 2838-BUY 2876 = -38 (14.10)

102)14.10>LONG 2876-SELL 2824 = -52 (18.10)

JANUARY 2012 contract
103)18.10>SHOT 2832-BUY 2874 = -42 (19.10)

104)19.10>LONG 2874-SELL 2986 = +112 (27.10)

105)27.10>SHOT 2986-BUY 2947 = +39 (02.11)

106)02.11>LONG 2947-SELL 2937 = -10 (03.11)

107)03.11>SHOT 2937-BUY 2970 = -33 (03.11)

108)03.11>LONG 2970-SELL 2993 = +23 (04.11)

109)04.11>SHOT 2993-BUY 3018 = -25 (04.11)

110)04.11>LONG 3018-SELL 3030 = +12 (09.11)

111)09.11>SHOT 3030-BUY 3085 = -55 (10.11) ##

112)10.11>LONG 3085-SHOT 3163 = +78 (14.11)

113)14.11>SHOT 3163-LONG 3199 = -36 (15.11)

114)15.11>LONG 3199-SELL 3188 = -11 (15.11)

FEBRUARY 2012 contract
115)15.11>SHOT 3188-BUY 3230 = -42 (16.11)

116)16.11>LONG 3229-SELL 3239 = +10 (17.11)

117)17.11>SHOT 3239-BUY 3261 = -22 (18.11)

118)18.11>LONG 3261-SELL 3216 = -45 (21.11)

119)21.11>SHOT 3216-BUY 3182 = +34 (22.11)

120)22.11>LONG 3182-SELL 3147 = -35 (23.11)

121)23.11>SHOT 3147-BUY 3130 = +17 (24.11)

122)24.11>LONG 3130-SELL 3080 = -50 (25.11)

123)25.11>SHOT 3080-BUY 3053 = +27 (01.12)

124)01.12>LONG 3053-SELL ?? =


TOTAL POINTS = From 1st Jan 2011>> +1273 points